



SitagriDesktop
The leading platform for agricultural markets.
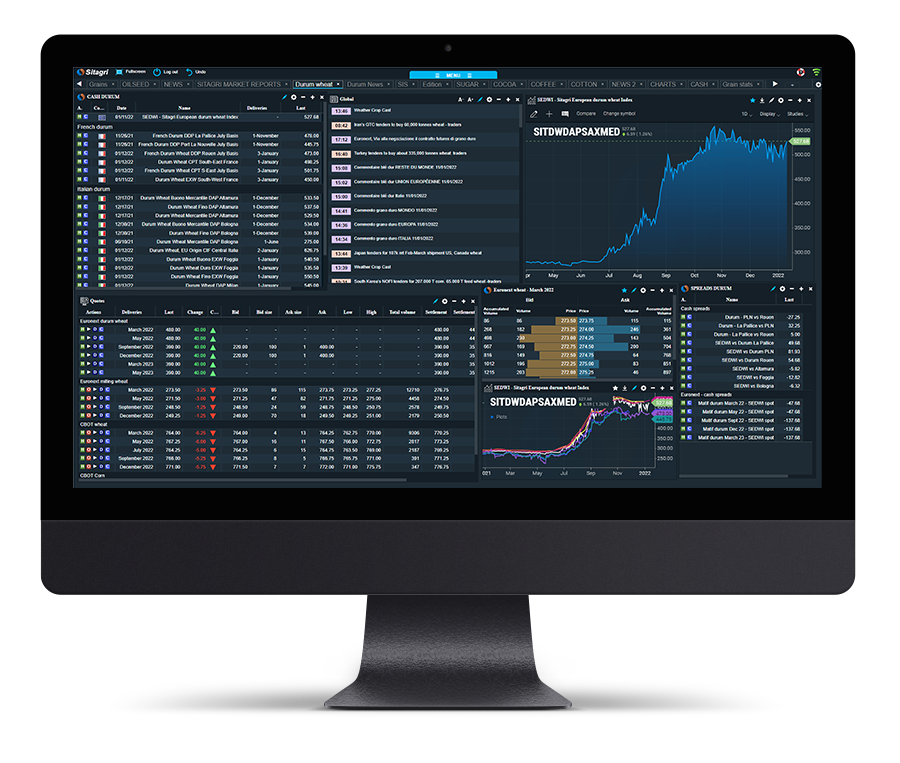
Designed for users.
Zero friction. 100% market.
No installation, no time wasted. Open Sitagri, and the information is there — clear, immediate, and actionable from the very first minute.
100% web-based, accessible from any workstation: at the office, on the go, or between meetings, you never take your eyes off the market.
Futures, physical prices, freight, weather, analysis: all the information that moves the markets, in real time, wherever you are.
50
COMMODITIES COVERED
20
YEARS OF FUTURES PRICE HISTORY
1 000+
CASH PRICE BENCHMARKS
15+
INTEGRATED SOURCES (EURONEXT, CBOT, ICE…)
600+
ACTIVE CLIENTS
Stay connected to the markets.
Continuously.
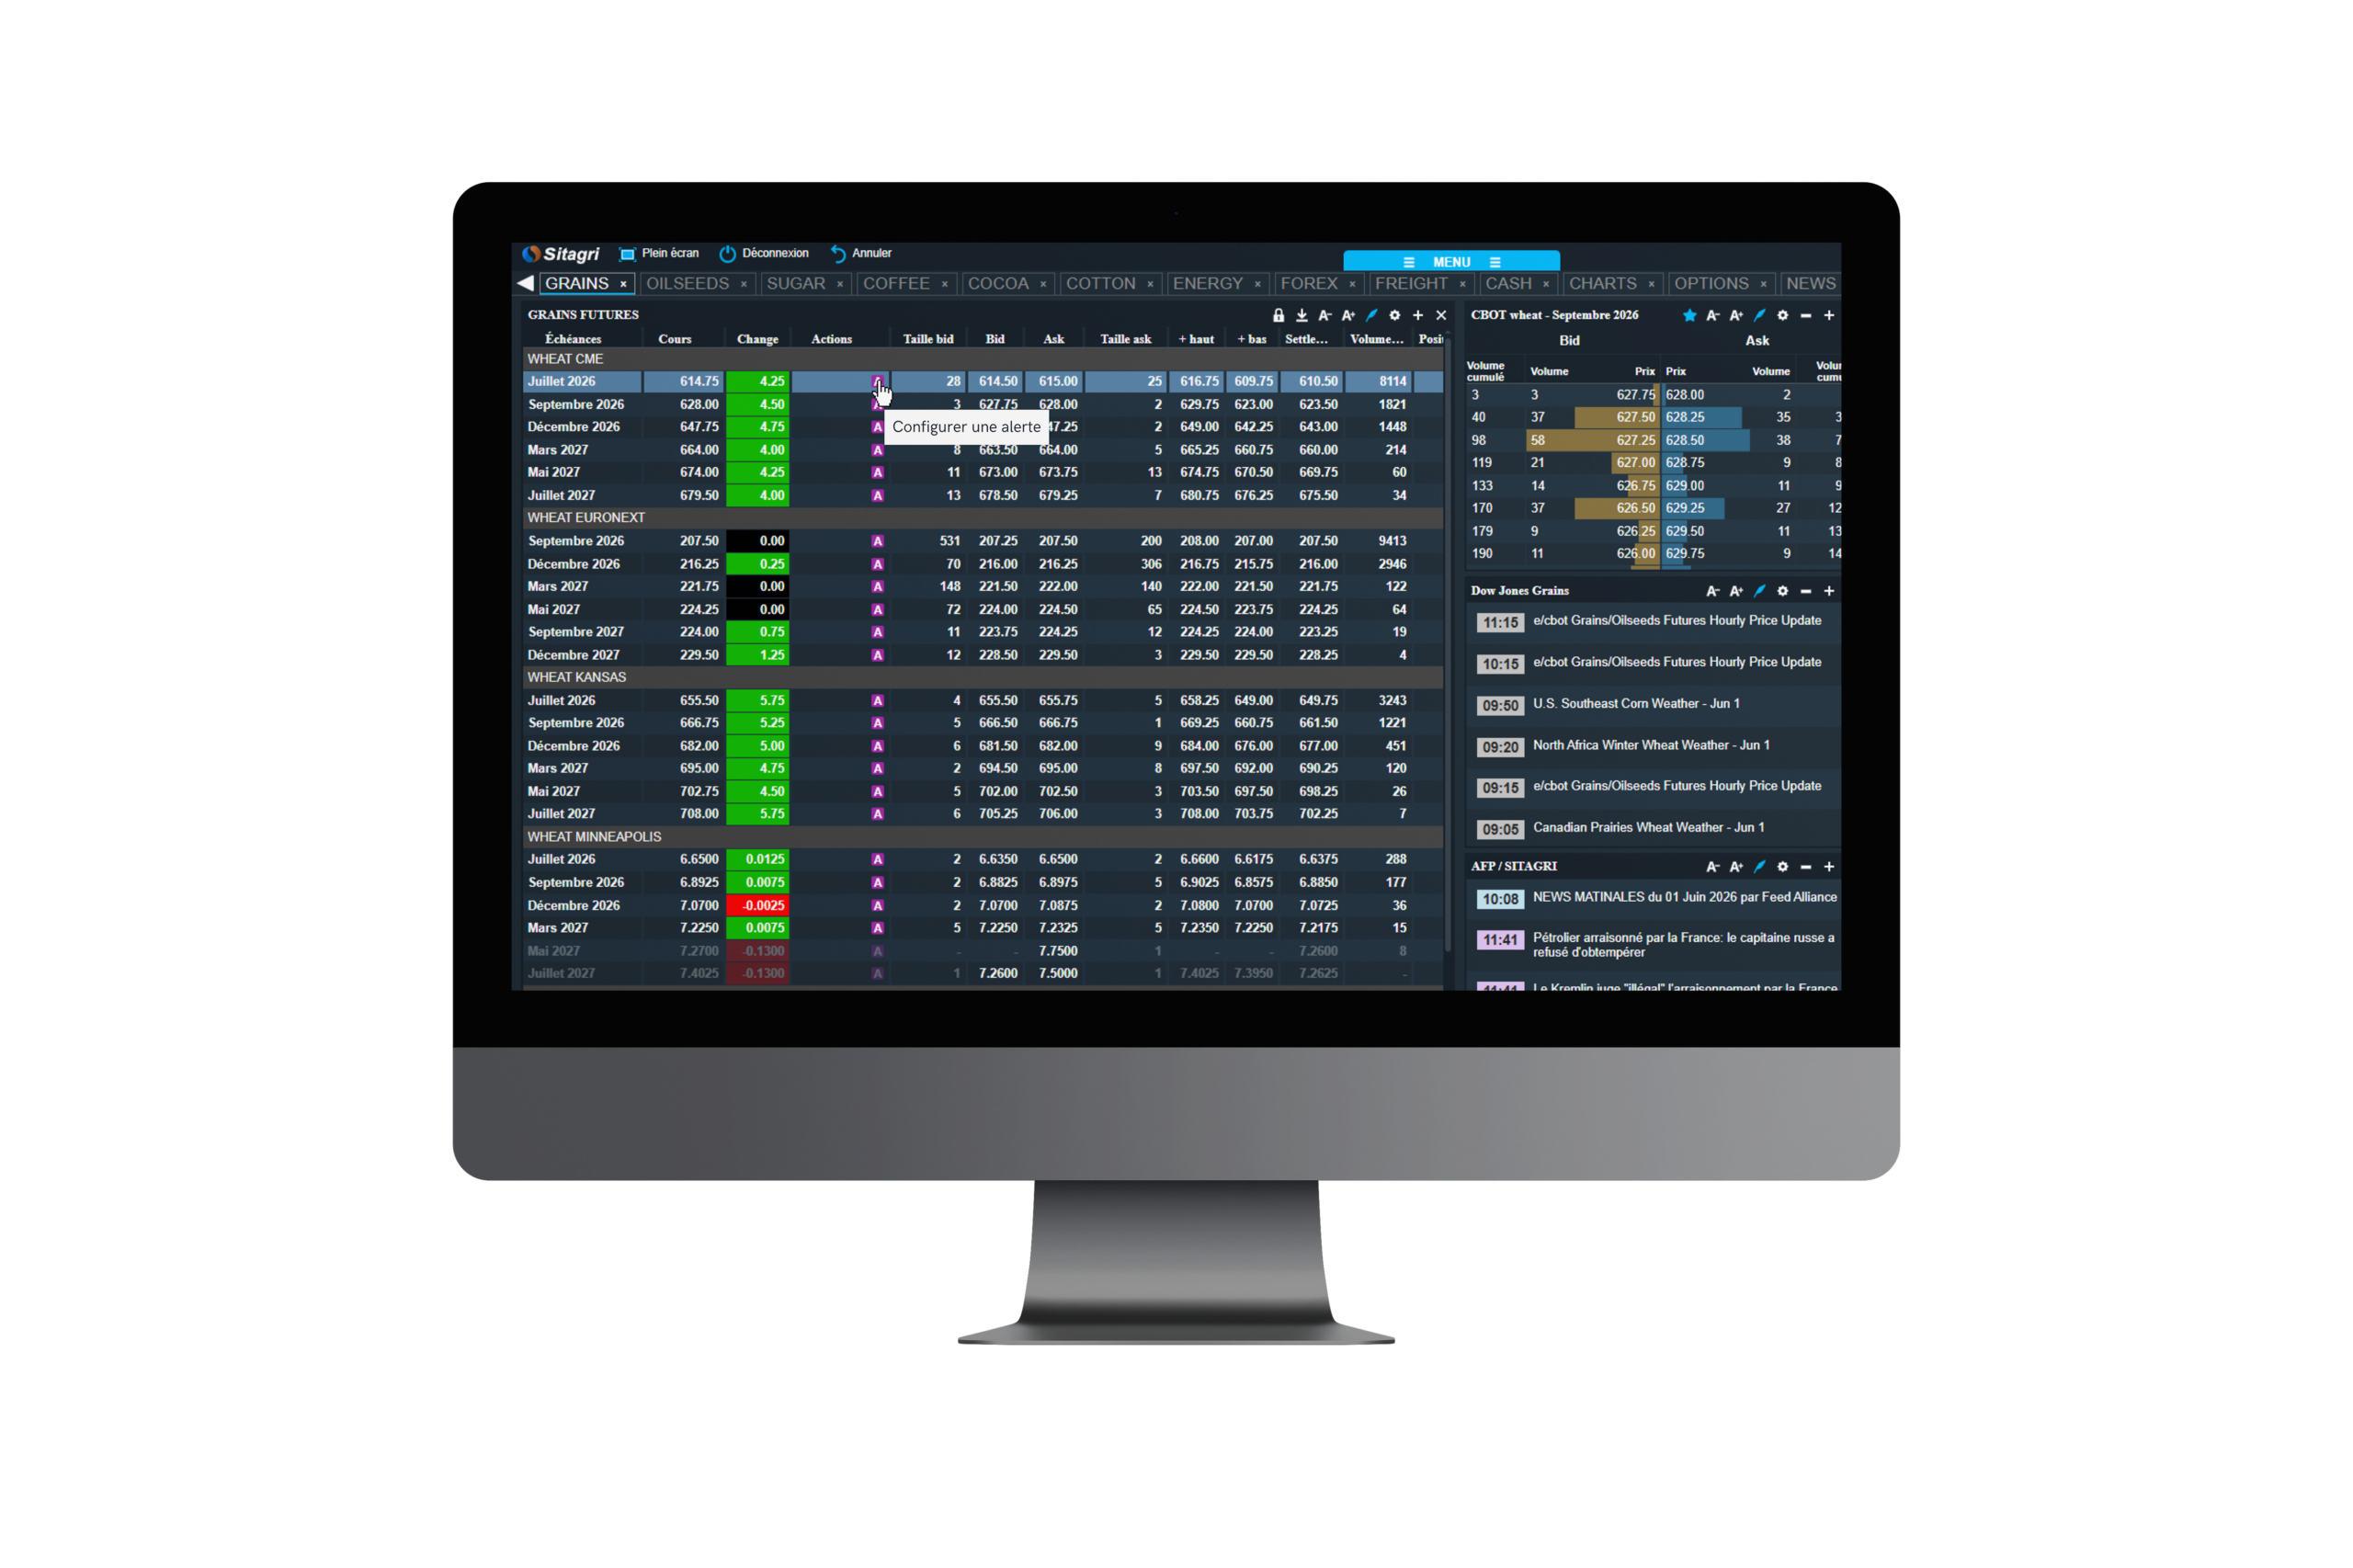
Sitagri brings together everything commodity professionals need in a single interface: real-time derivative prices, physical prices, news, fundamental analysis, ocean freight, and agro-meteorological data.
100% web-based. No installation required. Accessible from any workstation.
What you will find in Sitagri
All data in a single interface.
Futures markets
Real-time prices on Euronext (milling wheat, corn, rapeseed), CBOT (wheat, corn, soybeans), and ICE (coffee, sugar, cotton, cocoa). Order book, volumes, open interest, and 20 years of history to contextualize every move.
Display of Call/Put options, with the possibility of linking to a real-time pricer to value your positions instantly.
Use our smart shortcuts to display, sort, and extract history in just a few clicks — save time where every second counts.
Charts
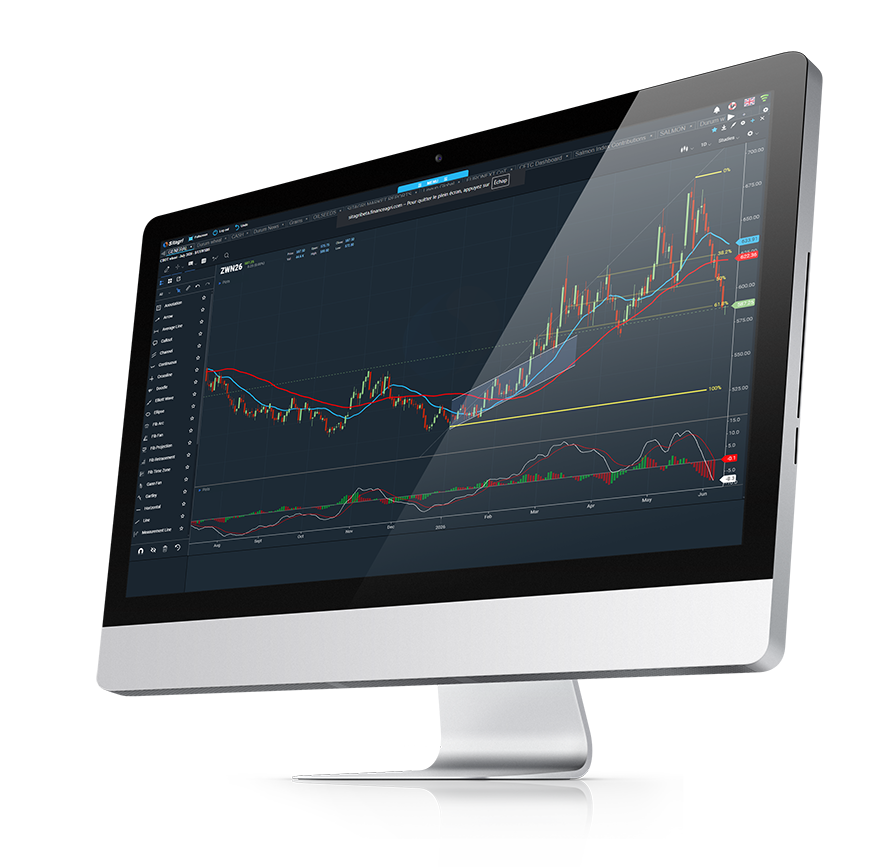
Over 125 technical indicators and 20 chart types (candlestick, Renko, Kagi, Point & Figure…), advanced drawing tools (Fibonacci, Elliott wave), and multi-expiry and multi-product comparisons as well as real-time seasonality charts.
Ocean freight
Daily freight rates on over 100 grain and oilseed routes — USA, Black Sea, Argentina, France, Australia, Canada — to Asia, Africa, the Middle East, the Mediterranean, and Latin America.
Baltic Indices (Baltic Dry Index, Panamax, Supramax, Handysize) and Clean Tanker Index, with price history and charts by route. Compare, track trends, and anticipate your logistics costs route by route.
A comprehensive tool for
your technical analysts.
Sitagri offers a complete technical analysis platform that meets all your needs, from moving averages to oscillators, support and resistance levels, and technical indicators.
Draw, measure, project. A suite of advanced drawing tools (Fibonacci, Elliott wave, trend lines, annotations) allows you to build your analysis directly on the chart.
Apply your studies to any time interval, from seconds to monthly, and track market movements tick by tick, in real time.
Your market reading. Your tools. No compromises.
With Sitagri, you have access to:
• 125+ technical indicators (MACD, RSI, Bollinger, Williams %R, Alligator…);
• 20 chart types, including candlestick, Renko, Kagi, Point & Figure, and Heikin Ashi;
a suite of advanced drawing tools: Fibonacci, Elliott wave, trend lines, annotations;
• Studies applicable to any time interval: Tick, second, minutes, hour…
Never miss a market move again.
In fast-moving markets, every minute counts. Sitagri alerts allow you to track market threshold crossings in real time. For every significant move, a notification is sent instantly, allowing you to quickly seize opportunities and adjust your decisions accordingly.
READY TO WORK WITH
REAL DATA?
Request a trial from Sitagri and discover the leading platform for agricultural markets.
Cash prices
Over 1,000 international cash price references in grains, oilseeds, and softs, with regional bases — the physical price, the one that really matters, at a glance.
Forward prices are also available to anticipate your negotiations for upcoming delivery periods.
News & Market Reports
Real-time news feeds, market news, and daily Market Reports to understand the day’s movements and anticipate future trends. Essential information, without unnecessary noise.
Weather & conditions
Daily agro-meteorological bulletins, written by specialized meteorologists, covering wheat, feed grains, oilseeds, coffee, cocoa, and sugar.
Precipitation and temperature maps for 1-5 days, 6-10 days, and 15 days, NDVI (vegetation index) maps by major production region, and region-by-region analysis — USA, Black Sea, Europe, China, Argentina, Australia — to anticipate the impact of weather conditions on production and prices.
Set up alerts.
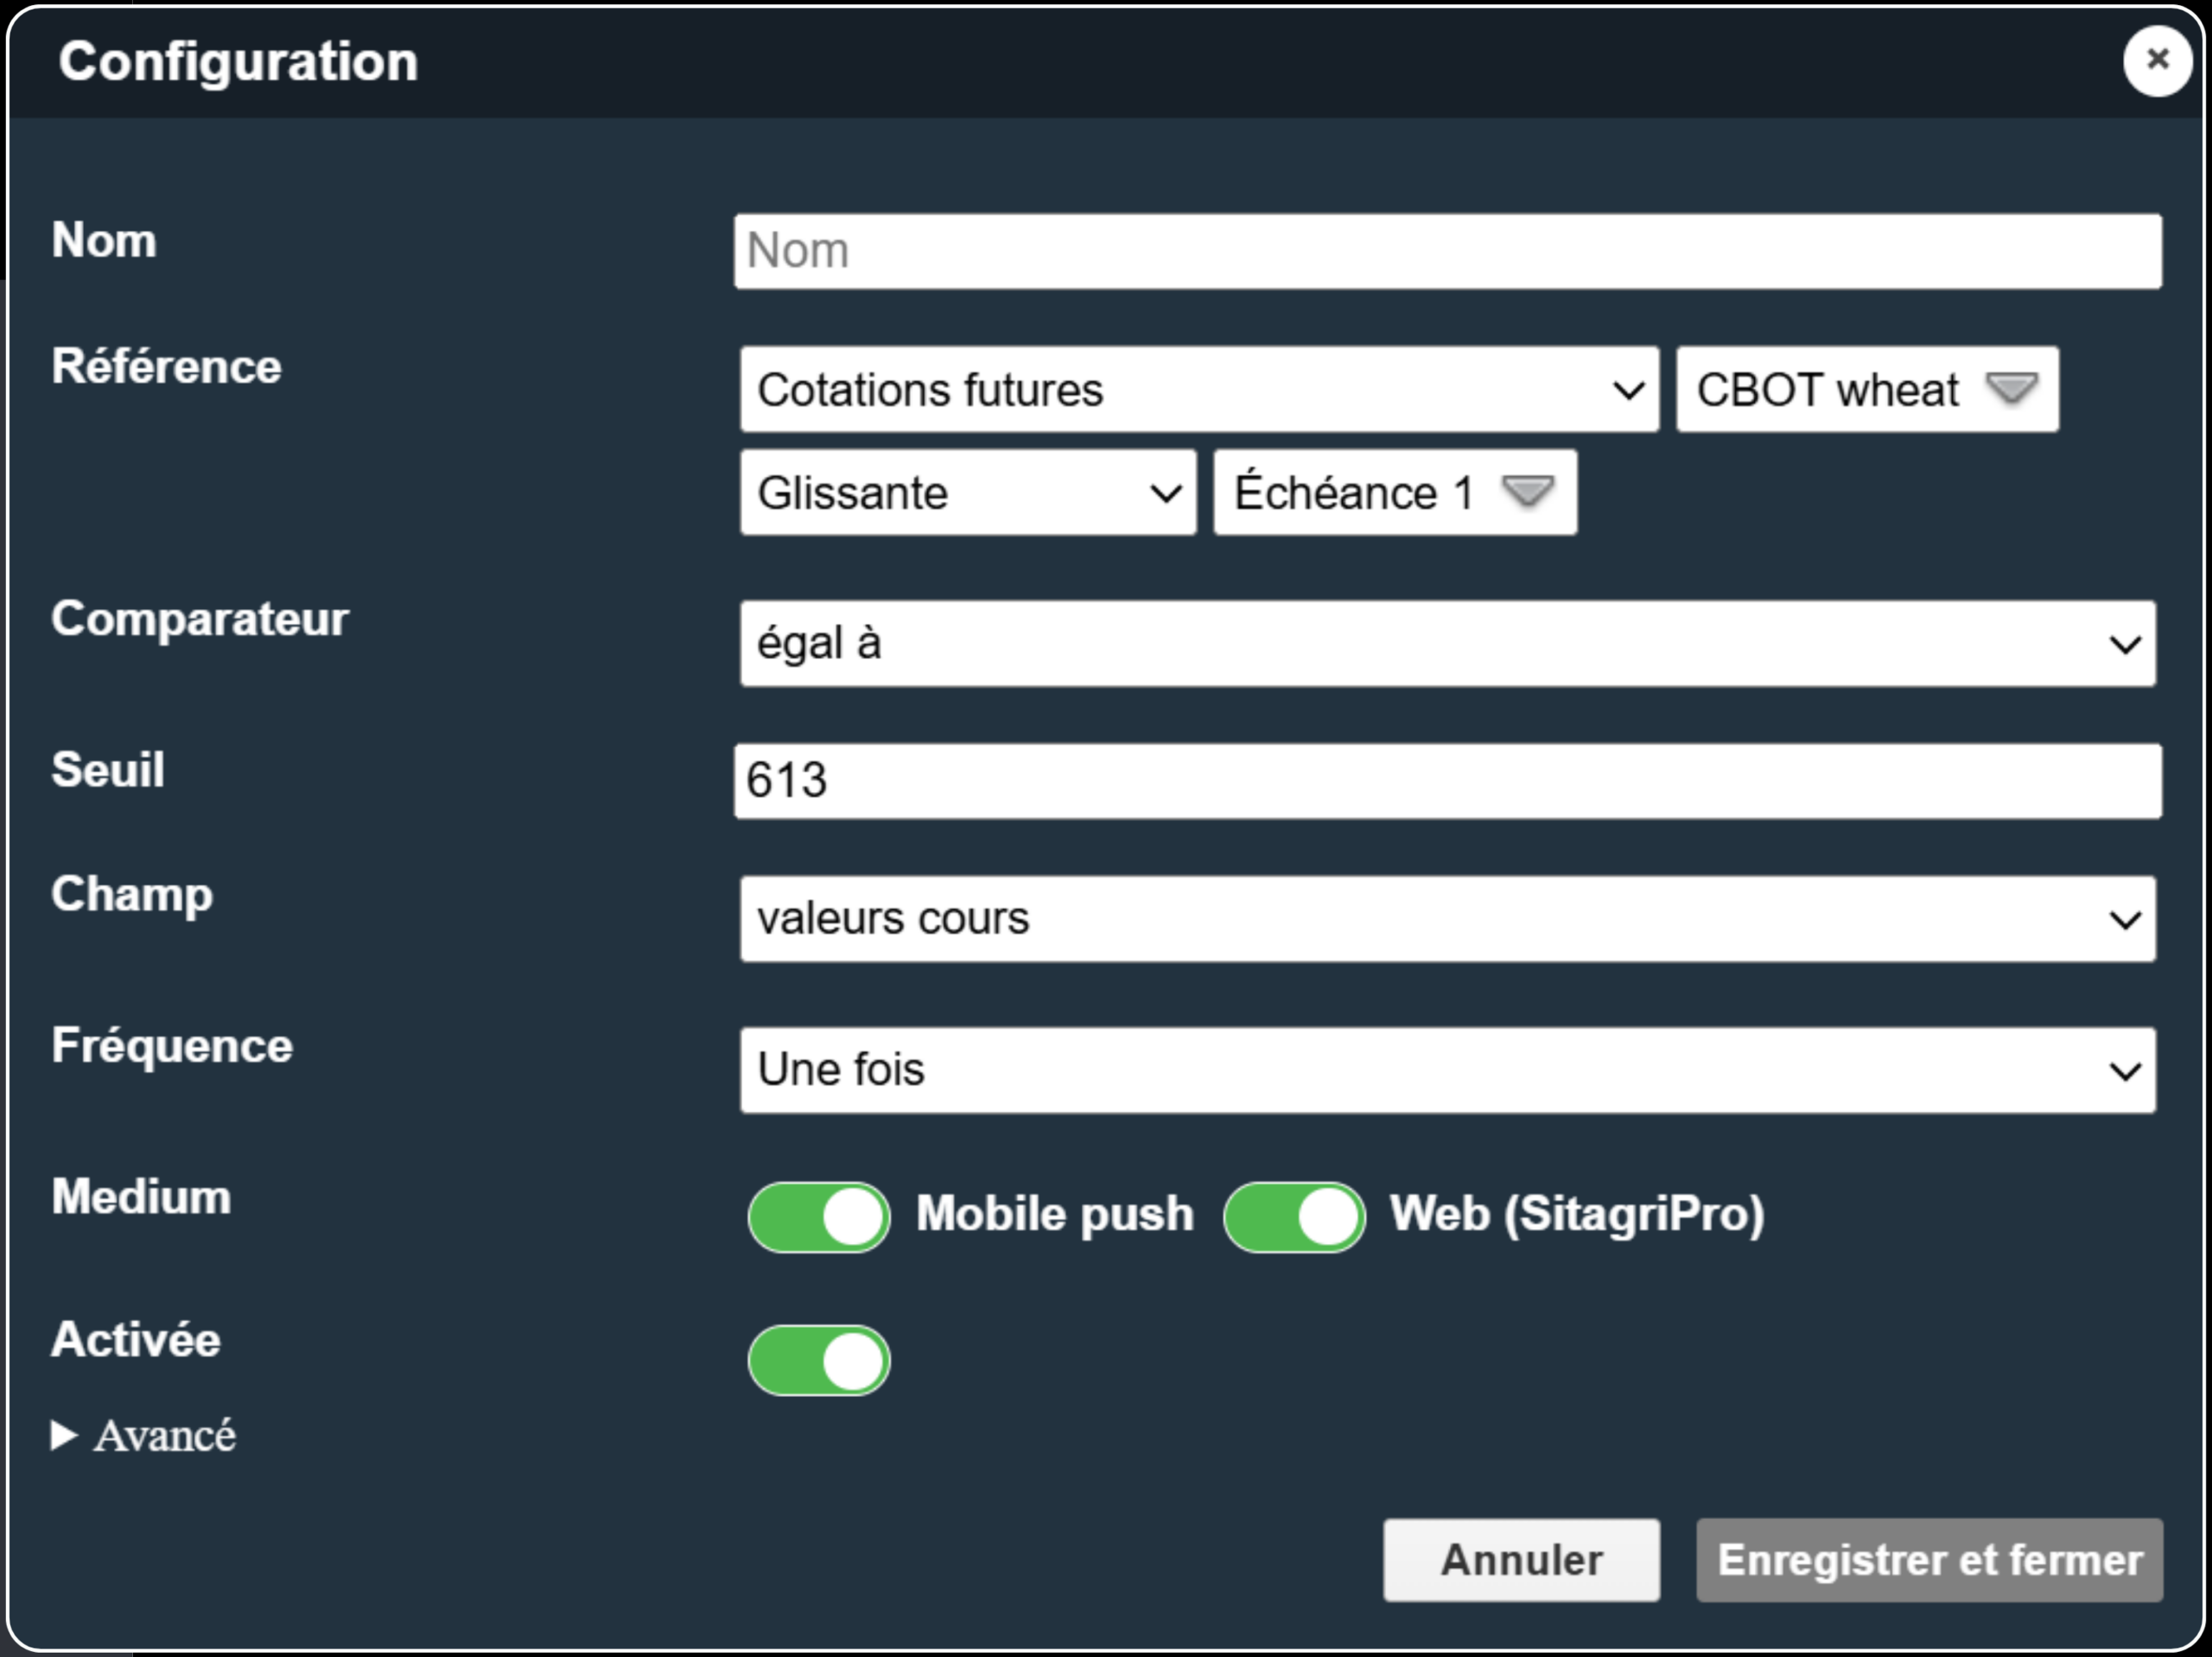
Configurable in just a few clicks on the indicators of your choice — Last, Bid, Ask, Settlement — alerts adapt to your way of working and your markets. A discreet but highly effective tool to increase responsiveness when opportunities arise.
Follow us

© FinanceAgri 2026 | Legal notice | Index methodology | Contact